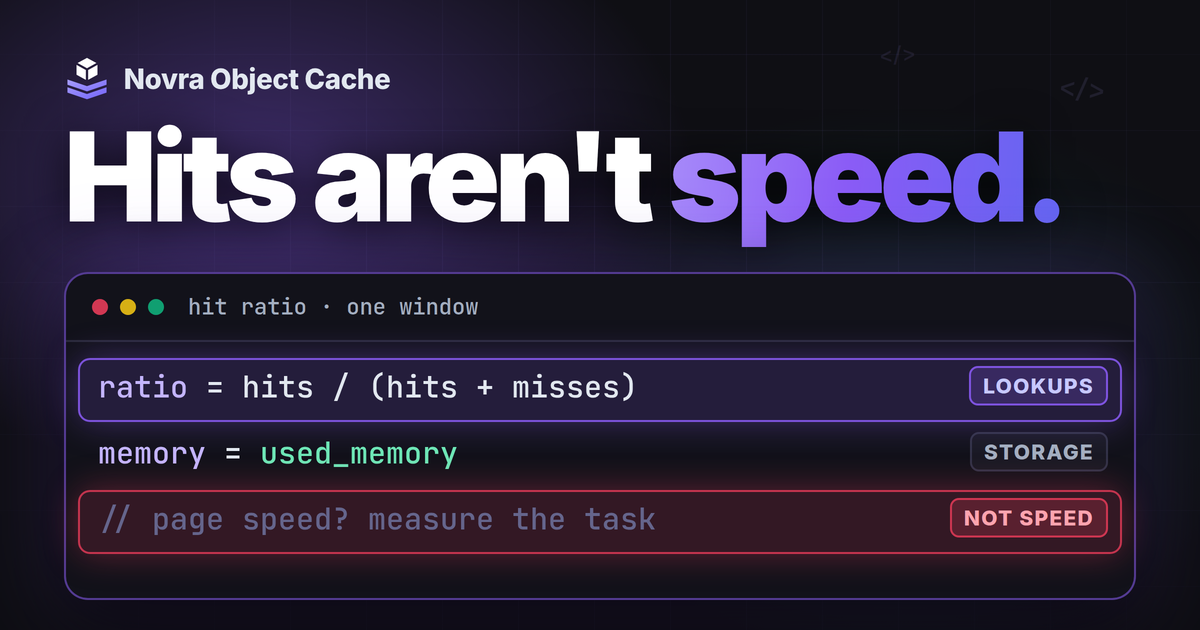
A WordPress Redis cache hit ratio measures successful cache lookups, not page speed. Memory usage describes storage consumption, not how much faster WordPress became. Read both over a defined period, with the same measurement scope, alongside task timings and correct results.
Redis is a fast memory store. An object cache uses it to retain suitable WordPress data between requests, such as opening pages. With supported Redis hosting, Novra Object Cache brings cache statistics and connection checks into WordPress. That makes it a useful starting point for the workflow below.
This is a documentation-based measurement guide, not a benchmark. We make Novra Object Cache. The controls described here come from its published documentation, not a test of your installation.
Start with one useful site task
Choose a task you want to assess: opening the same filtered admin list, for example. Record the expected data and when the task becomes usable. A fast public homepage does not answer whether that logged-in task improved.
Write down the environment, login state, task inputs, timing method, and current cache provider. Choose a start and end time, including the time zone. Use comparable tasks and traffic conditions when comparing windows.
If you lack measurements from before installation, do not invent a before-and-after gain. You can assess current behavior and investigate a problem without disabling a working cache.
Use Novra to check what is actually running
Novra needs a Redis service supplied by you or your host. It also requires PhpRedis, the PHP add-on that lets it communicate with Redis. PHP is the language WordPress runs on. Novra does not provide the Redis server or connect to Memcached.
For an existing Novra setup, open Novra Object Cache → Dashboard. Then review Tools → Site Health → Status. These documented checks answer different questions:
- Redis Object Cache Connection: did Redis answer, or did the check report an error?
- Object Cache Drop-in: is WordPress’s cache integration file missing, supplied by Novra, or supplied by another provider?
- Object Cache State: did that checked request use Redis, run without Redis, or have caching disabled?
- Redis Memory Usage and Redis Eviction Policy: what does the check report about the instance’s memory and its full-cache behavior?
- Object Cache Errors: did errors occur during the checked request?
The Novra Site Health reference explains these labels. Treat a skipped check as unavailable evidence, not a pass. One request’s state does not establish the state of every visitor request.
Test Connection in Settings checks the values currently in the form. It does not prove those values are the running cache’s effective settings. Do not save changes, enable the cache again, or replace another provider merely to collect statistics.
Identify the scope before comparing numbers
Write down what each number counts. A WordPress request, a plugin chart, and an entire Redis server are different measurement scopes.
The default WordPress object cache works within one request. Its own hit counter can increase without Redis. WordPress also supports non-persistent cache groups: related entries deliberately kept out of persistent storage. The WordPress object-cache reference describes these distinctions.
Redis’s keyspace hit and miss counters describe lookups handled by the Redis server. On a shared instance, they can include other sites or applications. A site’s key prefix or logical database number does not turn these server-wide counters into site-only measurements.
Novra publishes dashboard views for the last hour and last 24 hours, with charts grouped into five-minute or one-hour steps. It documents hit ratio, response speed, memory, throughput, and cache-group reporting.
The public documentation does not specify the exact counter scope, reset rules, or aggregation formula for every chart. Record the selected view and its displayed labels. Do not relabel it as your site’s Redis-only hit rate without confirmation from support or your maintainer.
The documented Enable Analytics option controls historical charts, not whether caching runs. An empty chart alone does not prove an empty or broken cache. Record unavailable history instead of changing settings during your baseline.
Calculate hit ratio for one defined window
A hit means the requested cache entry was found. A miss means it was not found at that measured layer. The Redis cache-statistics guide gives this calculation:
Hit ratio = hits / (hits + misses) × 100The denominator is counted lookups, not page views, visitors, or every Redis command. A hit is not a one-for-one count of saved database queries.
If your host supplies cumulative Redis counters, request two readings from the same instance at your window’s boundaries. Use the increases during that window:
Window hits = end keyspace_hits - start keyspace_hits
Window misses = end keyspace_misses - start keyspace_misses
Window ratio = window hits / (window hits + window misses) × 100
Hypothetical arithmetic, not a measured Novra result: suppose the counters increase by 900 hits and 100 misses. The ratio for those 1,000 lookups is 90%. That number is neither a recommended target nor evidence that pages became 90% faster.
If no lookups were counted, report “not measurable in this window,” not 0% or 100%. For several comparable windows, combine the hit and miss counts. Do not take a simple average of percentages from windows with different lookup totals.
Keep counter history comparable
Ask the host whether Redis restarted, statistics reset, or monitoring changed instances during the interval. Redis documents that a statistics reset changes the hit and miss counters.
If continuity is broken or uncertain, discard that comparison and start a new window. Do not reset statistics or restart Redis to obtain a cleaner-looking result.
Cache warm-up means useful entries are accumulating through normal work. Record initial observations separately from later repetitions. Note content imports, updates, background jobs, and changes in the mix of logged-in and public visits.
Low reuse, expiring entries, deliberate invalidation, and memory-driven removal can all affect misses. Investigate the pattern before changing anything. There is no universal hit-ratio target that proves a useful WordPress result.
Read WordPress Redis cache memory usage in context
There is no fixed megabyte allowance that fits every WordPress site. The amount needed depends on the stored entries and workload. More allocated memory is not automatically useful; lower usage is not automatically better.
Novra’s Redis Memory Usage check is documented as instance-level. Do not describe it as this site’s exclusive share on shared Redis. Ask the host which allocation you use and whether other workloads share it.
If the host provides a Redis memory report, these names help separate different quantities. They are Redis reference fields, not a claim that Novra displays every field.
| Redis field | What it describes | How to use it |
|---|---|---|
used_memory |
Current bytes allocated by Redis, including internal overhead. | Track its trend for the same instance, alongside the host’s capacity assessment. |
used_memory_dataset |
Allocated memory minus Redis’s reported overhead. | Distinguish stored data from the total allocation. It is not a per-site total. |
used_memory_rss |
Memory held by the Redis process as seen by the operating system. | Let the host investigate a large difference from allocated memory. This is not the same measurement. |
used_memory_peak |
The recorded peak memory consumption. | Distinguish a historical high point from current use. |
maxmemory |
The configured limit used for cache-memory management. | Ask the host about the limit and required overhead. Zero does not mean unlimited physical RAM. |
evicted_keys |
The count of keys removed because of the memory limit. | Compare its increase during the same window, not just its accumulated total. |
The Redis INFO field reference defines these values. Memory readings are snapshots; hit and eviction counters accumulate activity. Record memory at the beginning and end, and any observed peak during your window.
Redis’s memory limit is not a cap on every byte the host process might need. Some replication or persistence buffers are excluded from eviction accounting. Your host must leave appropriate capacity for the whole service.
Separate expiry from memory pressure
Expiration removes an entry after its lifetime ends. Eviction removes an entry to make room under the memory policy. Those are different reasons for data to disappear.
Rising evictions alongside more misses and slower tasks are a reason to investigate capacity and the workload together. Evictions alone do not identify a particular site’s fault. With the noeviction policy, commands adding data can fail when memory is full instead of making room.
Give the host the readings and errors. Let the responsible operator choose any memory-limit or policy change. Do not copy a generic policy or keep clearing Redis to reduce a graph.
Compression packs stored data; a serializer converts values into a storage format. Novra exposes these options, but changing them is not a harmless statistics adjustment. Its documentation says changing Serializer clears the cache. Agree on a separate test and recovery plan before tuning.
Repeat the task and record the result
- Capture the starting state. Record Novra’s connection, integration, errors, chart view, and available memory readings. Mark unknown scope or missing history explicitly.
- Repeat the chosen task several times with the same inputs, login state, and timing method. Keep initial observations separate from later repetitions.
- Write down each measured task time. Note failures and whether the displayed data is current and belongs to the correct account.
- At the agreed end time, capture the same metrics. Calculate window deltas only when the counters and their continuity are confirmed.
- Compare a second representative window if conditions differed. Keep monitoring scope and task definitions consistent.
Use a separate, appropriately isolated test environment for planned configuration comparisons. Do not flush production, restart services, or switch drop-ins to create a cold-cache experiment. Ordinary observations can establish a baseline without those changes.
Use this empty record; leave measurements blank until observed:
Task, inputs, login state, and expected data:
Environment, provider, and responsible person:
Start/end time and time zone:
Timing tool and individual task times:
Initial observations versus later repetitions:
Novra connection, drop-in, state, and errors:
Chart label, selected view, and confirmed/unknown scope:
Redis instance and shared/dedicated status, if confirmed:
Hit/miss counter readings and continuity confirmation:
Memory readings, limit, and eviction change, if available:
Traffic, jobs, updates, errors, and correctness notes:
Conclusion, remaining uncertainty, and next owner:
Choose the next action from the evidence
| Observation | Useful next step |
|---|---|
| Connection or integration fails. | Resolve that specific state with the maintainer before interpreting a headline ratio. |
| Low ratio during initial or changed work. | Repeat representative work and compare matching windows. Check expiry, invalidation, and scope before tuning. |
| Memory pressure, rising evictions, or rejected writes. | Have the host review shared workloads, capacity, and policy with the recorded task results. |
| High ratio but the task remains slow. | Ask the developer to locate the remaining wait. Do not treat the ratio as a speed result. |
| Memory grows, but tasks remain correct and stable. | Check the trend and available capacity. Growth alone does not establish a leak or a reason to clear the cache. |
| Metrics are unavailable or their scope is unknown. | Record the gap and request its definition. Do not present an unsupported site-specific improvement. |
If a public page is fast but a logged-in action is slow, review which work page caching and object caching can reuse. A cache hit does not remove every other part of building and displaying a page.
For supported Redis hosting, explore Novra Object Cache’s monitoring controls if visibility inside WordPress is what you need. Its published offer is one payment, no subscription, and a 30-day money-back guarantee. Confirm hosting requirements before purchasing.
Already using it? Start with one measured task and the separate status checks. Keep a working setup when it meets your needs. Change it only when the evidence identifies a useful next step.